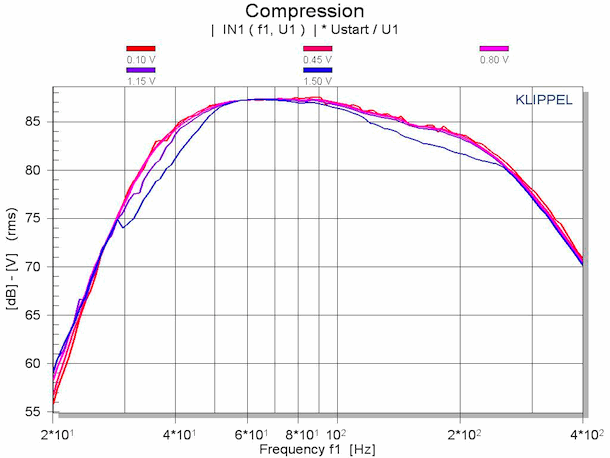
Whenever we at FAC design a subwoofer, we test after finishing the equalizing what the loudspeaker does at higher levels. The best method is to do a compression measurement. During this measurement, the input level of the subwoofer is increased and we check if the output level changes follows
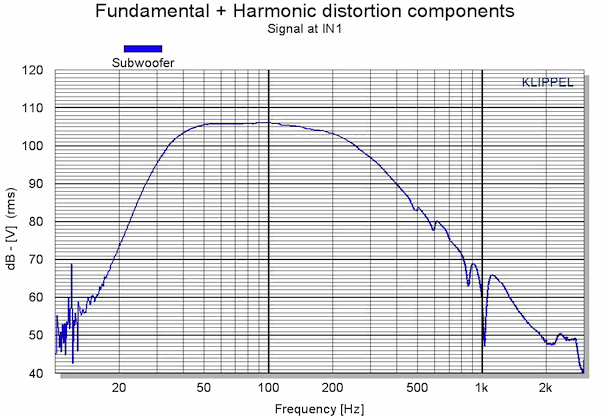
If you normalize the results to the starting value, you can get a nice picture of what the sub does in real life.
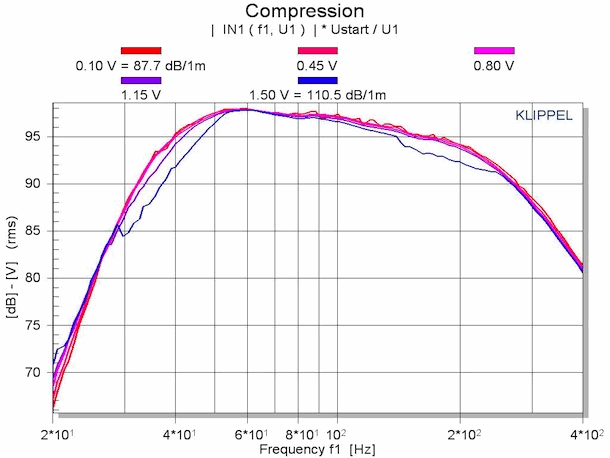
There are two obvious sources of compression. First of all – in case of a ported design- the port starts to fail at higher levels due to too high air velocity, with the result that the region around the tuning frequency does not go loud enough.
The second effect is the thermal compression. The coil get’s hot, therefore the resistance rises and the result is a lower level.
But if you carefully compare the response curve of the compression measurements, you see that there is a difference. Even so the “static” measured curve looks flat, ALL compression curves – even the low level ones – show some slightly falling character.
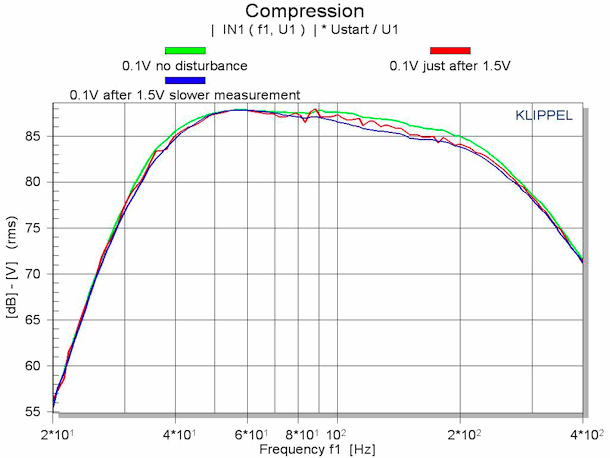
So what happened? Well, in case of this particular measurement, the driver is measured at each individual frequency with all the defined level steps. During that period from small voltage to larger voltage, the temperature rises in the voice coil. When jumping to the next frequency, even at the lowest level, the coil is still hot and so the level is slightly reduced. So far, so good, but due to the impedance curve of the subwoofer, this change in level is not constant over frequency. At the impedance peak around 60Hz, the level difference is much smaller. As a result, this level stays more or less even at higher levels, but above and below, the levels goes down, depending on the temperature of the voice coil.
One the measurement below the following test was done: The green curve shows the standard measurement with a relatively low input level of 0.1V. The red one was done again with 0.1V just after finishing a high level faster sweep with 1.5V. The blue curve shows the same, but this time the high level sweep was done slower to give the coil time to heat up.
One could say this is a fault in the measurement and maybe it needs to be changed to avoid that effect, but if demonstrates nicely what happens in the real world with music or a movie. The coil get’s hot during peaks or heavy bottom end and the resulting response curve is changing. For the design process it means to make sure that from the frequency of the high impedance peak, the “static” response rises slightly around 1dB. That means in real live you get a better balanced behavior.
This modification might not make a good subwoofer starting with a bad one, but a carefully look at thermal compression cannot be wrong and it is not a lot more work to take care about the effects.
Thanks to Christian Gather, who made all the measurements and had the initial idea.

